Documentation
Get information on the following topics:
-
Setup – what to do if Nagstamon has been installed
-
Actions – custom actions for hosts/services context menu
-
Notifications – how to customize notifications
-
Regular Expressions – how to use regular expressions for filters
-
Requirements – what you need to run Nagstamon, especially if developing
Setup
Linux
Download Nagstamon as .deb or .rpm and install its dependencies.
Start it in a terminal:
# nagstamon
You can choose a config directory manually:
# nagstamon <your-custom-configdirectory>
Alternatively Nagstamon can be found in your Applications menu.
Windows
Download Nagstamon as .exe according to you binary platform (32 or 64 bit) and execute it. Everything should get at its place and you can start it from Start menu/Programs/Nagstamon. When run from command line you can pass a config directory in case you want to store it at another place than the default one:
c:\> "c:\Program Files\Nagstamon\nagstamon.exe" <your-custom-configdirectory>
Alternatively you can download the matching .zip which contains a complete standalone Nagstamon.
macOS
Since version 2.0 Nagstamon does not need any external package to run as it did before. Just download the .dmg disk image file and put the included Nagstamon app wherever you like – most probably the /Applications folder.
Other OS / Source
Download Nagstamon as .tar.gz, extract the archive, fulfill its requirements and install Nagstamon into your local python installation:
# python setup.py install
The start script mostly is /usr/local/bin/nagstamon.py.
First steps
At the first start of Nagstamon a dialog window appears where you have to configure at least one monitor server to check.
Configure your monitor server installation:
- the monitor server type,
- the URL of your monitor main page,
- only on Nagios, older Icinga and Thruk: the URL to your monitor CGI – without any status.cgi etc.
- the username
- the password
- a proxy if necessary
If you want to store the password in your system’s keystore/keyring/vault you can enable it at the first tab of the settings dialog.
The config directory as default is in $HOME/.nagstamon.
Actions
For years Nagstamon allowed certain context actions to be taken to failed hosts and services. These actions include acknowledging and connecting via some remote connection methods like SSH and RDP. The already known builtin actions still can be taken but also the user has the freedom to define some actions which fit the needs of the actual environment. Nagstamon comes with some examples.
There are builtin actions:
- Monitor – open host/service page of monitor’s web interface in browser
- Recheck – checks the sate of the host/service again
- Acknowledge – allows acknowledging host/service problem like in web interface
- Downtime – maybe a little late but just in case allows to set a host/service into maintenance
These builtin actions are not available for every monitor type:
- Submit check result – allows submitting any check result like in web interface – not for every monitor
- Archive events – only for Check_MK
Nagstamon comes with some preconfigured custom actions which simply connect to a host via the protocol stated in their names:
- RDP
- SSH
- Telnet
- VNC
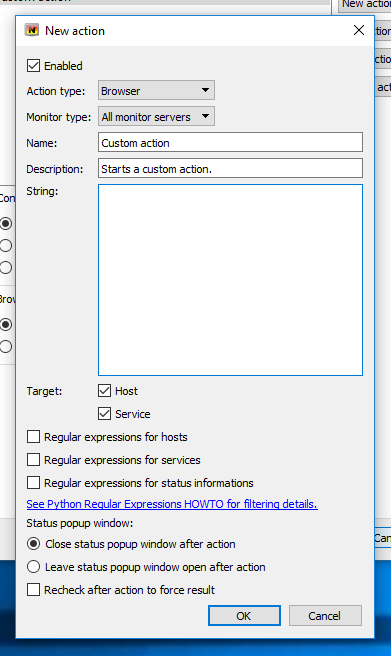
There are also a lot of example but disabled actions included. These actions may be of those types:
- Browser – call browser with certain given URL
- Command – call external command with certain related arguments
- URL – call any URL in background with arguments, for example a CGI action
The command and URL calls can be constructed of some placeholder variables:
- $HOST$ – host as in monitor
- $SERVICE$ – service as in monitor
- $MONITOR$ – monitor address (https://monitor/….)
- $MONITOR-CGI$ – monitor CGI address
- $ADDRESS$ – address of host as set in Nagstamon settings (Hostname/DNS/IP)
- $USERNAME$ – username on monitor
- $STATUS-INFO$ – status information for hosts and services
- $PASSWORD$ – username’s password on monitor
- $COMMENT-ACK$ – default acknowledge comment
- $COMMENT-DOWN$ – default downtime comment
- $COMMENT-SUBMIT$ – default submit check result comment
The following examples might illustrate the possibilities provided by custom actions.
1st Example: Ping command
For diagnosis purposes it might be a good thing to permanently ping a host. To have a console executing such a ping it might take only one click.
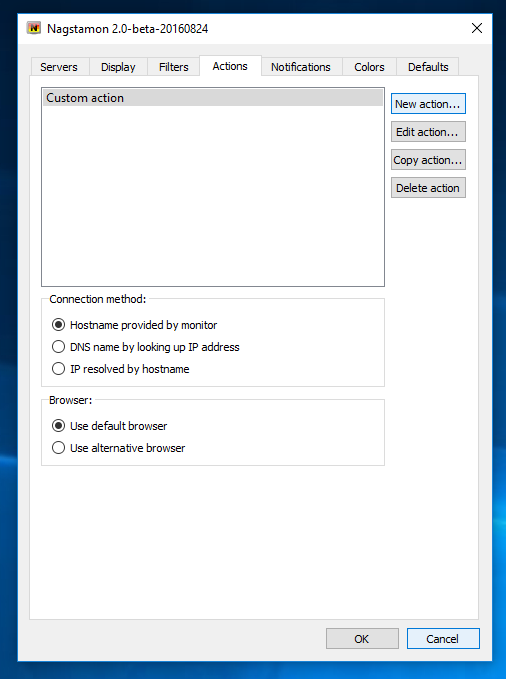
First open action settings:
There are some example actions one could use to have a look at but here a new action will be created with “New action…”:
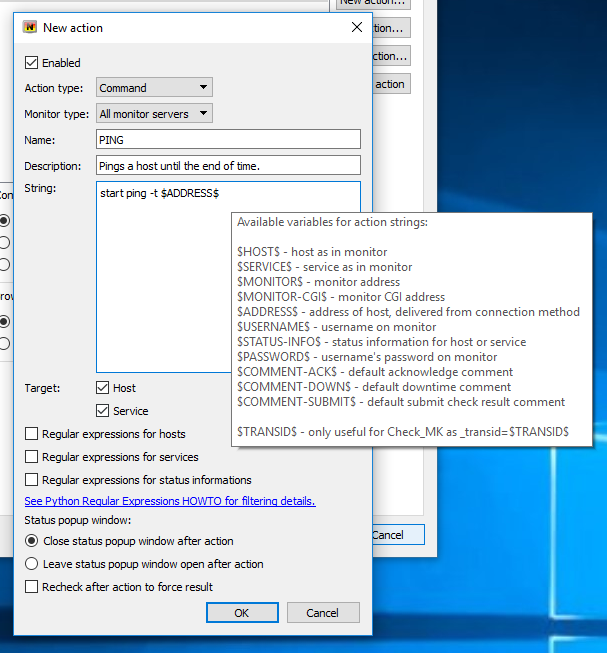
Here we go:
As described above there are 3 types of actions. In this case it will be a command so this type will be choosen. An unique name has to be given, for example PING. Some description might help to remember what the actions is good for. The heart of the whole action is the string which will be given as external call. It is OS dependent and would be similar like these:
- Windows:
start ping -t $ADDRESS$ - Linux:
gnome-terminal -e "ping $ADDRESS$" - macOS:
/usr/X11/bin/xterm -e -ping $ADDRESS$
If an action only applies to services or hosts its target could be set. Regular expressions are optionally possible to filter out hosts and services to keep the actions menu as usable as possible. The behaviour of the popup window could be set too – if it stays opened it might cover a new terminal window.
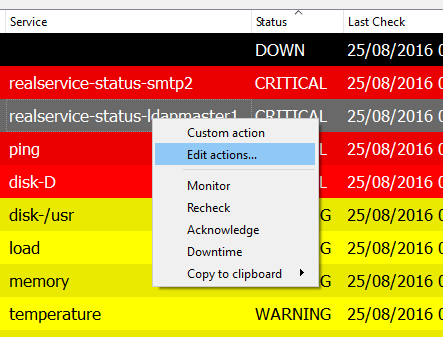
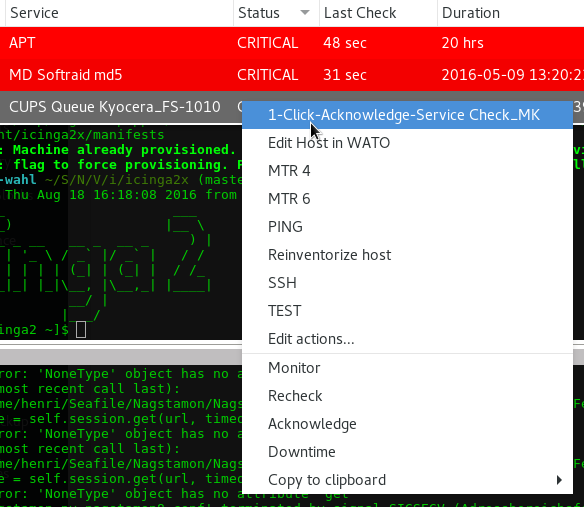
Now the new PING action appears in context menu:
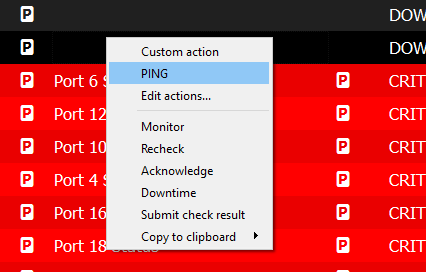
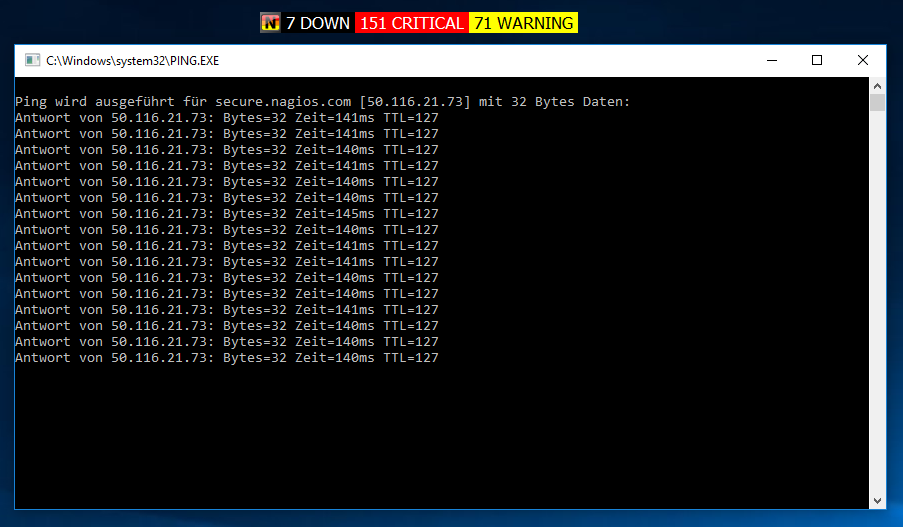
After clicking PING a Terminal window appears which runs the ping command with the host address inside:
2nd Example: Performance data in Browser
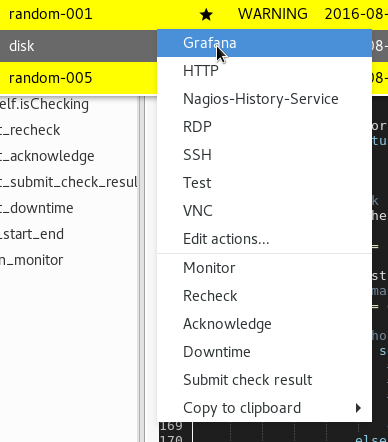
IcingaWeb2 comes with Grafana integrated and it is an easy task to access the performance data of an host or service in your browser with one click in the context menu. First we need to find out the Grafana-URL of a service:
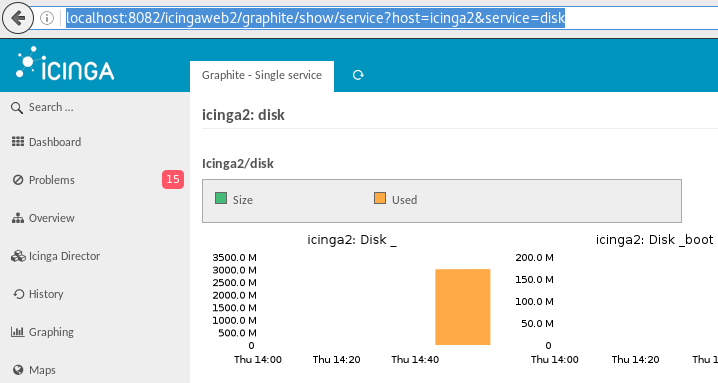
Here we see the URL of the performance data of host icinga2 with service disk:
http://localhost:8082/icingaweb2/graphite/show/service?host=icinga2&service=disk
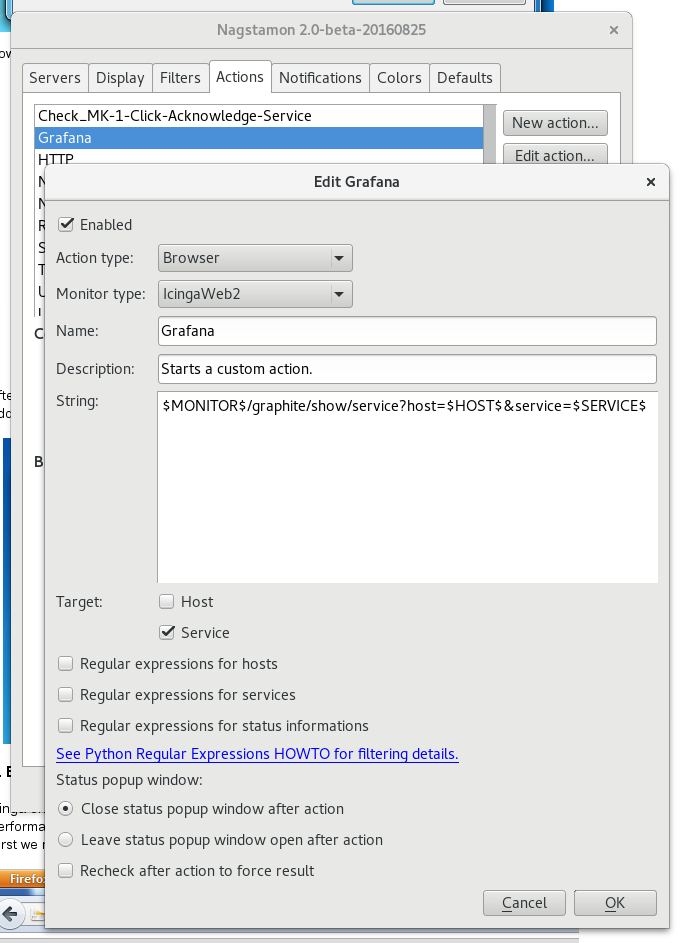
So we need to use this URL when creating an appropriate action and replace icinga2 by variable $HOST$, disk by $SERVICE$ and http://localhost:8082/icingaweb2/ by **$MONITOR$ which looks this way:
$MONITOR$/graphite/show/service?host=$HOST$&service=$SERVICE$
With type Browser and target Service this is a complete action:
The next time a host or service has trouble one could easily access its performance data with one click:
3rd Example: CGI URL call
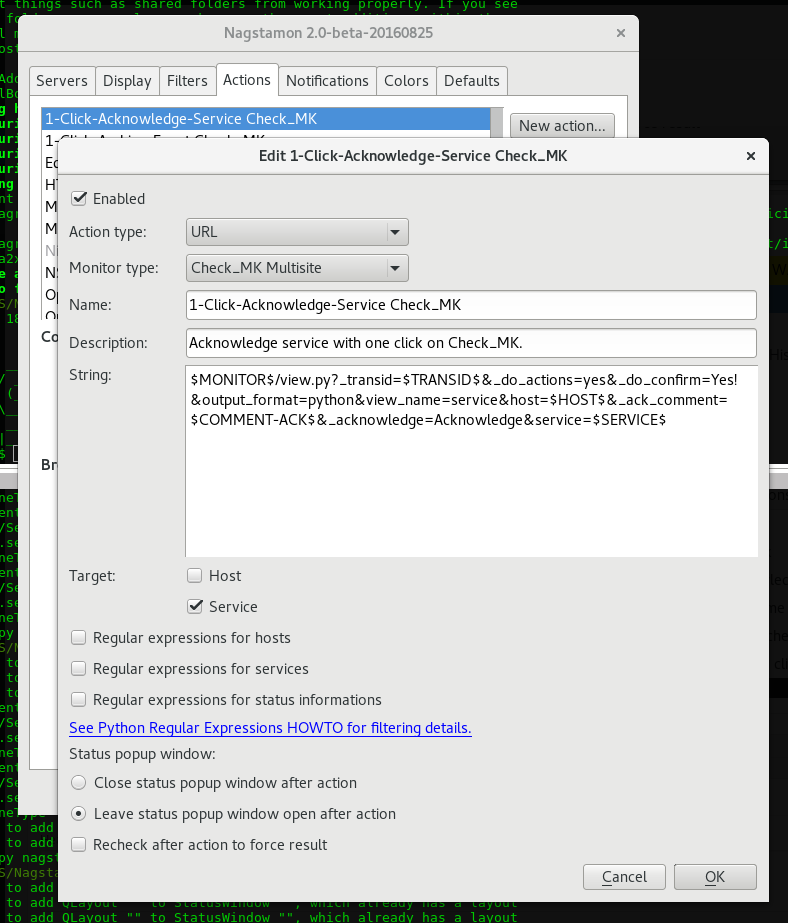
There are already builtin CGI URL calls like acknowledging a host or service. These can easily be extendend, for example with an acknowledgement of service problems done with one click:
$MONITOR$/view.py?_transid=$TRANSID$&_do_actions=yes&_do_confirm=Yes!&output_format=python&view_name=service&host=$HOST$&_ack_comment=$COMMENT-ACK$&_acknowledge=Acknowledge&service=$SERVICE$
This should apply only to a service because the URL for hosts is different:
Now a service can be acknowledged with just one click:
Notifications
States
Notifications can be triggered by states of different severity:
- WARNING
- CRITICAL
- UNKNOWN
- UNREACHABLE
- DOWN
Default Notifications
As default the statusbar or systray icon flashes on new events.
On Linux systems a notification via libnotify on desktop is an additional option.
Users can be notified by default or sound alerts.
Custom notification actions
There are two kinds of custom notification actions:
-
The first allows to define some command to be run if one of the states WARNING, CRITICAL, DOWN or OK appears. Only the command defined for the worst state will be executed. This option is inspired by https://github.com/HenriWahl/Nagstamon/pull/50.
-
The second allows to run some custom command or script which handles states and status informations itself. The events can be separated by the event separator for easier distinguishing them. Here two options exist:
- Handle all events by one command
- Handle every event with one separate command
Regular Expressions
Nagstamon allows the use of regular expressions for filtering hosts and services for status popup and actions. Detailed information can be found at https://docs.python.org/howto/regex.html.
Regexp filter settings can be found in filters tab and in actions:
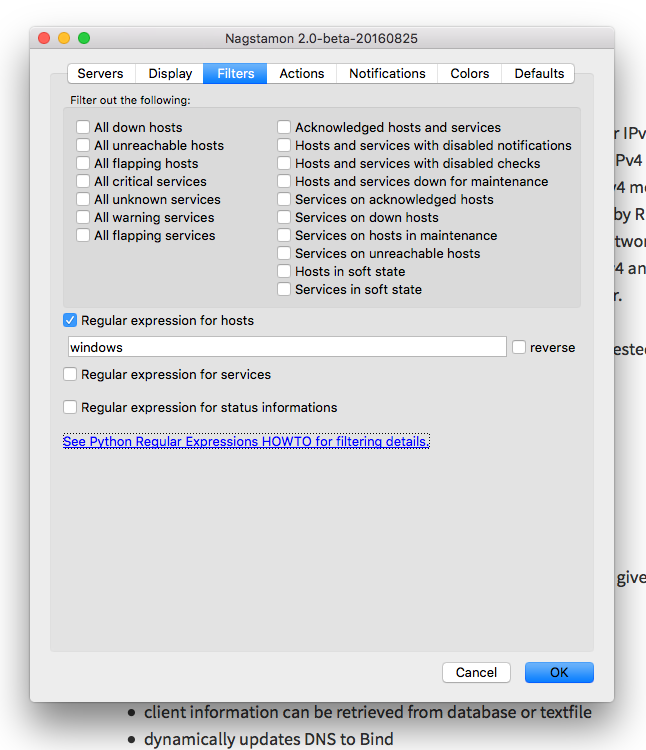
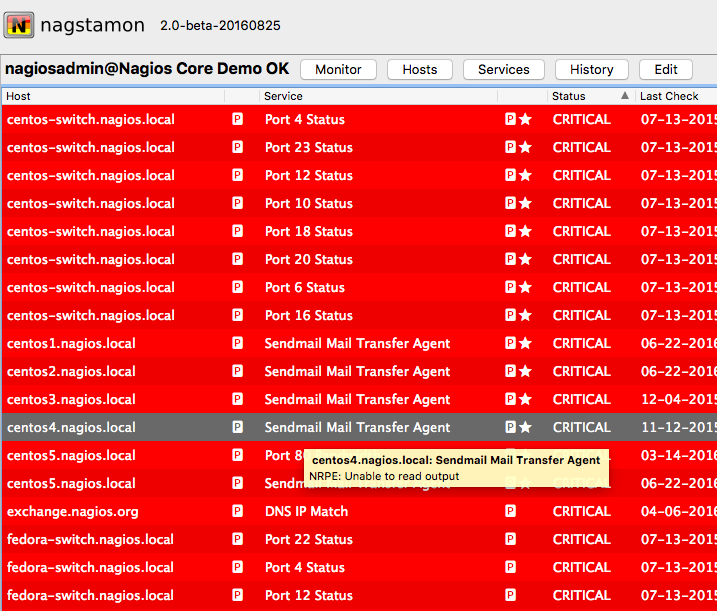
1st Example: Host filter
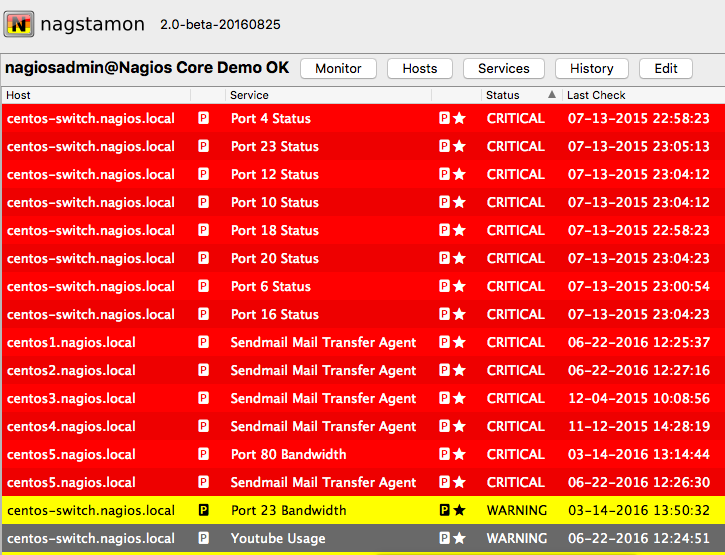
If the default list of hosts looks like this…
…and you for whatever reason have to filter out a certain group of hosts, for example all hosts with centos in their name, you add this filter…
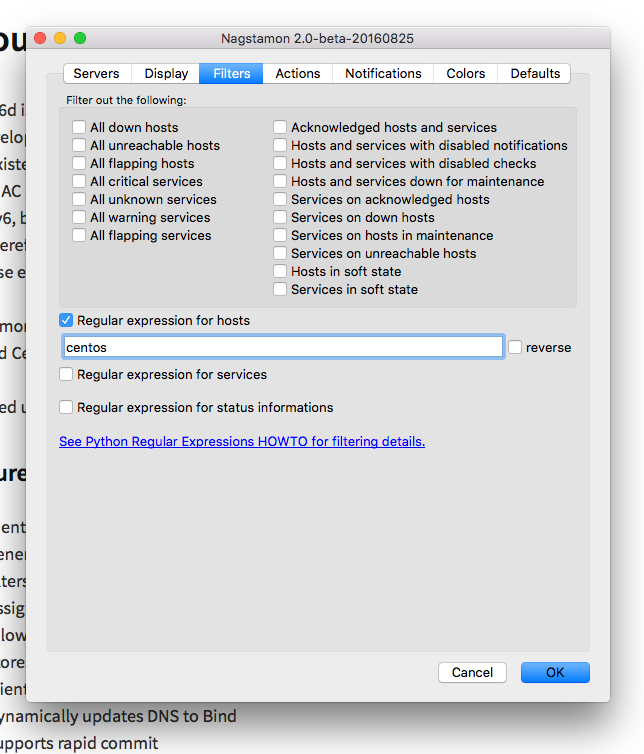
…and the list of host gets shorter…
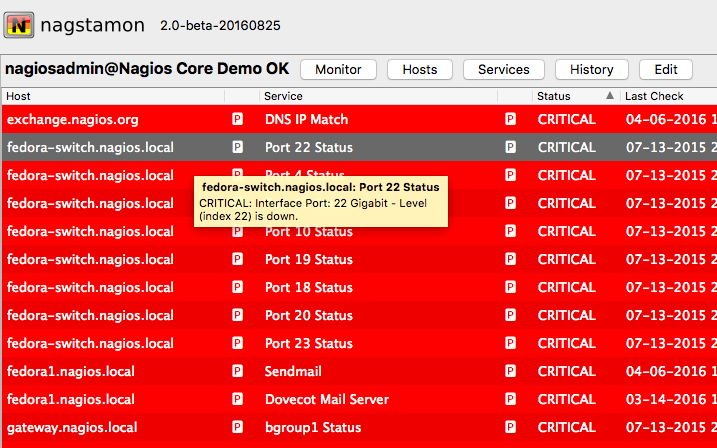
2nd Example: Reverse host filter
If you need to see only the hosts of a certain type, for example only hosts with www in their name, just add the reverse option…
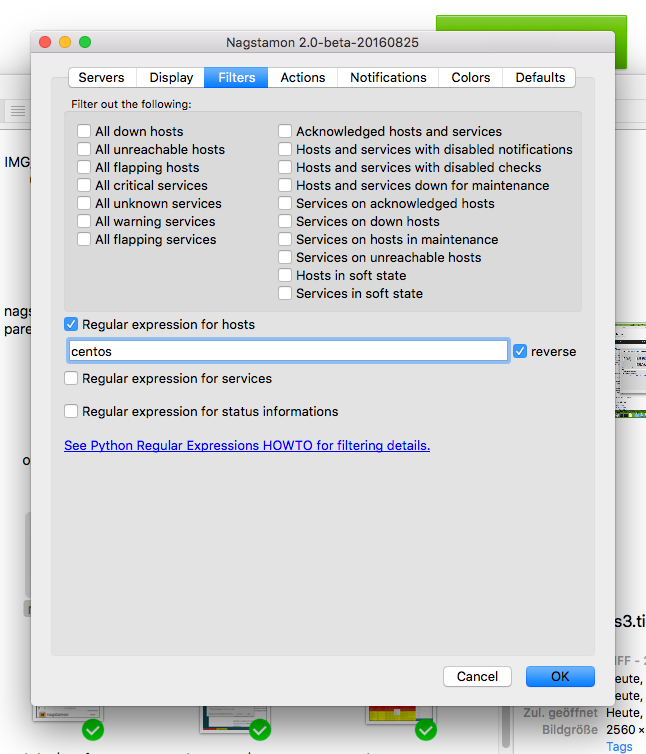
and monitor only the hosts you are interested in:
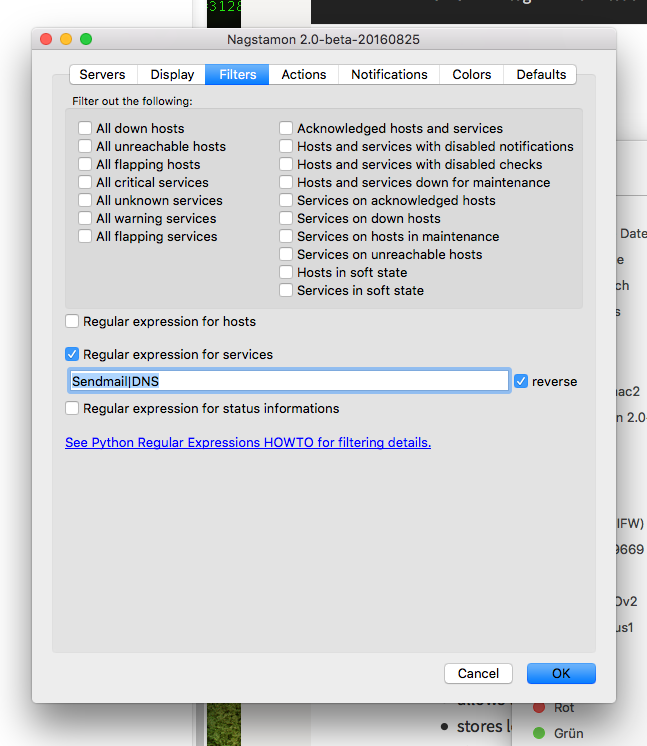
3rd Example: Multiple Service filters
Surprisingly filters for services work in a similar way. To raise the level of complexity a little bit in this example there should be only shown Sendmail or DNS services. Multiple items get concatenated with |, so the filter looks like this:
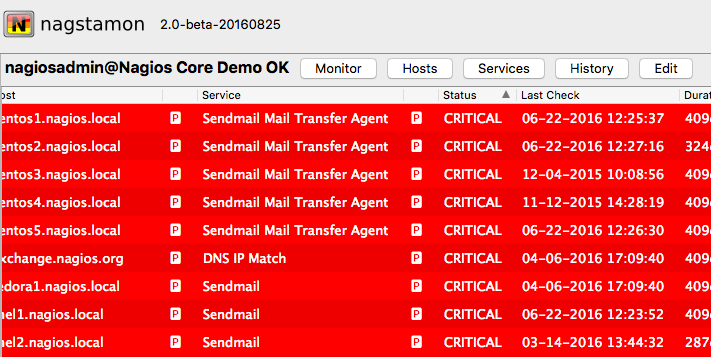
The resulting list is shorter:
4th Example: More regular expressionism
The above examples are pretty simple. If you need more sophisticated filters here are some more rules:
- ^ marks the beginning of an expression
- $ marks the end
- . is any character
- .* is any number of any character
- | adds several expressions with logical OR
For further information please see https://docs.python.org/howto/regex.html.
Requirements
If you do not use a binary release of Nagstamon, the following requirements have to be fulfilled:
- Python >= 3.10, available at https://www.python.org/downloads/
-
Several Python modules available via PIP:
- beautifulsoup4 – http://www.crummy.com/software/BeautifulSoup/
- keyring – https://github.com/jaraco/keyring
- lxml – http://lxml.de/
-
psutil – https://github.com/giampaolo/psutil
- pypiwin32 – https://pypi.python.org/pypi/pypiwin32
- pyqt6 >= 6.10 – https://riverbankcomputing.com/software/pyqt/
-
pysocks – https://github.com/Anorov/PySocks
- python-dateutil – https://dateutil.readthedocs.io/en/stable/
- requests – http://docs.python-requests.org/en/latest/
- requests-kerberos – https://github.com/requests/requests-kerberos
- requests-gssapi – https://github.com/pythongssapi/requests-gssapi
Linux
All of these are included in any Linux distribution – no PIP required.
For creation of binary packages one might need to install the typical packaging utilities of the choosen distribution to use the included build.py script.
Windows
If you want to run Nagstamon from sources on Windows, you have to run this PIP command after installing Python. Note that even if there is a newer version right now only keyring 10.5.1 works as expected in Windows:
C:\python314\scripts\pip install -r build/requirements/windows.txt
If you want to create binary packages with the distributed build.py script, you also need
- PyInstaller – http://www.pyinstaller.org/
- InnoSetup >= 5.5 – http://www.jrsoftware.org/isdl.php
PyInstaller lastest development version which is known to work with Python 3.7 is needed so this one has to be pulled by pip:
C:\python314\scripts\pip install pyinstaller
macOS
Best experiences are being made with Python 3 from Homebrew. After installing Python 3 the other dependencies might be retrieved via PIP:
# brew install python3
# pip3 install  -r build/requirements/macos.txt
For binary packages made by the included build.py script you will need PyInstaller too.
# pip3 install pyinstaller